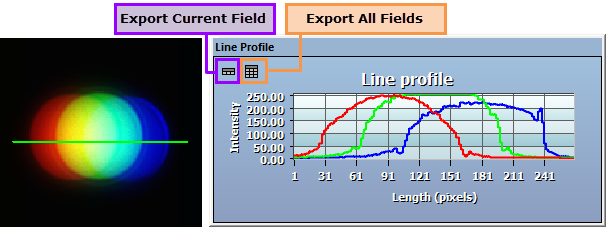
The Line Profile is a useful tool that allows users to draw line on the image and see the corresponding intensity values plotted on a graph. The line profile may be used in real time on a live image or a captured image or image sequence. For two and three channel color images, an intensity profile is plotted for each channel as it's respective color.

When defining a line profile, the user can determine the line thickness, as well as the type of line that they want to draw. The Line Profile icon is located in the Annotations toolbar, click the Line Profile drop-menu to view the line properties. The Line Profile Properties are defined below.
The intensity values for the line are plotted in a graph. The graph can be undocked and resized for optimal viewing. It is continually updated, when live or during playback. The intensity data can be exported to a spreadsheet and saved as a .csv (comma separated values) file. If a calibration was used, the scale factor values will be included in the exported data. There are two options for exporting data to a spreadsheet:
Note: When using the ORCA-Flash4.0 series or the ImagEM X2, the pixel values for line profile will be plotted in gray levels and electrons for monochrome images. Both pixel values will be included when exporting to a spreadsheet. For color images, the graph can be plotted as intensity or gray levels, the user can toggle begin the two by clicking the Electron Count button. Both pixel values will be exported. This feature is only available when using the ORCA-Flash4.0 series or the ImagEM X2.
To create a line profile, select the type of line you want to draw and the thickness from the Line Profile drop-menu. Each type of line is drawn slightly different, please see description below on how to draw the various lines. Move the cursor over the image to the starting point and draw the line. The intensity values are instantly plotted as you draw the line.